Data Analytics
.webp?width=7360&height=4912&name=data%20analytics%20(1).webp)
Better Data Analysis = Better Business Decisions.
With the explosion of technology that rapidly advanced the availability of information from the internet, apps, and business software, our economy has gone from information-scarce to data-rich in a very short period of time. This data, if used and analyzed appropriately, can provide businesses with crucial insight into the current health of a Company and the trajectory of a business in the future. This is the basis of what Data Analytics is all about, analyzing raw data and trends to answer many of your Company’s questions. Below are just some of the ways Larson advisors can help you utilize advanced tools to make sense of the overwhelming amount of data surrounding your business.
.webp?width=1774&height=1181&name=silicon%20slopes%20(1).webp)
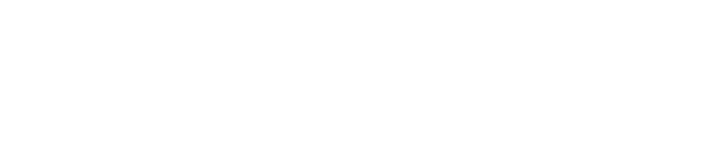
Vulnerability Scanning
What is it? Vulnerability scanning strengthens your cybersecurity defenses to identify and address vulnerabilities before attackers exploit them.
Larson & Company offers the following services to assist you in protecting your sensitive data and systems, reduce the risk of breaches and compliance failures, and reassure stakeholders your commitment to data security.
• Network Vulnerability Scanning: Comprehensive scans to detect weakness in your IT infrastructure
• Remediation Guidance: Detailed recommendations to fix identified issues
• Ongoing Monitoring: Regular scans to ensure continued protection
Our Data Analytics team is made up of industry experts with a deep knowledge of IT and compliance. Our proven track record of delivering actionable results can help you create customized solutions tailored to your business security needs.
.png)